Creates a Climograph of Weather data From Data Available Via weatherOz
Source:R/create_climograph.R
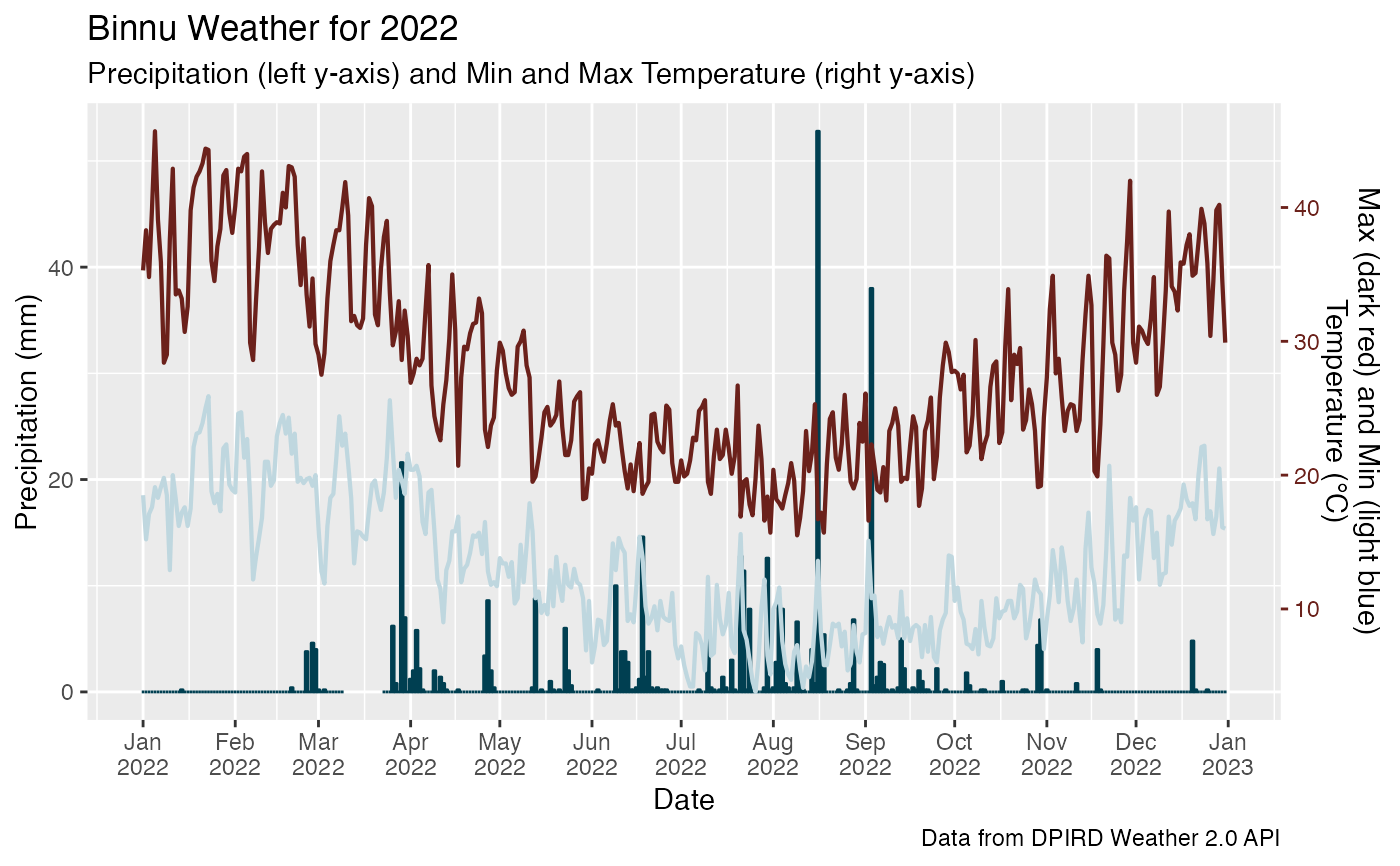
create_climograph.RdGiven weather data from weatherOz, create a climograph with maximum and minimum temperature on the left-hand y-axis and precipitation on the right- hand y-axis. The colours used are DPIRD's dark red (tmax), light blue (tmin) and dark blue (rain).
Value
A ggplot2 object.
Author
Adam H. Sparks, adamhsparks@gmail.com
Examples
library(weatherOz)
#>
#> Attaching package: 'weatherOz'
#> The following object is masked from 'package:graphics':
#>
#>     plot
#> The following object is masked from 'package:base':
#>
#>     plot
wd <- get_dpird_summaries(
  station_code = "BI",
  start_date = "20220101",
  end_date = "20221231",
  api_key = Sys.getenv("DPIRD_API_KEY"),
  interval = "daily",
  values = c(
    "airTemperatureMin",
    "airTemperatureMax",
    "rainfall"
    )
)

# create the {ggplot2} object
c_graph <- create_climograph(wd)

# add a title, subtitle and caption
library(ggplot2)

main <- "Binnu Weather for 2022"
sub <-
 "Precipitation (left y-axis) and Min and Max Temperature (right y-axis)"
cap <-
  "Data from DPIRD Weather 2.0 API"
c_graph +
  labs(
    title = main,
    subtitle = sub,
    caption = cap
  )
#> Warning: Removed 13 rows containing missing values or values outside the scale range (`geom_col()`).