Run length encoding to detect consecutive sequences of events.
Source
Raphael Saldanha, https://rfsaldanha.github.io/posts/run_length_encoding.html with modifications by Adam Sparks (DPIRD).
Arguments
- x
A vector of values to check for consecutive sequences of events.
- index
An index of event values, e.g. a vector of date values.
- l_run
An
integervalue indicating the length of the run for the period of interest.- value
The base value to check against, for which values greater than will be recorded as
TRUE.
Value
A data.table with three columns, the ‘index’, ‘x’,
the original value that was tested and ‘test’ a column of Boolean
values indicating whether the event was TRUE (greater than value) or
FALSE (less than value), “test”.
Note
R already has an base::rle(), so this function is suffixed with 2
to avoid NAMESPACE clashes.
Author
Adam Sparks, adamhsparks@gmail.com
Examples
# Get rainfall data since 2017 for Northam
library(weatherOz)
library(scales)
library(ggplot2)
wd <- get_dpird_summaries(
station_code = "NO",
start_date = "20170101",
end_date = "20171231",
api_key = Sys.getenv("DPIRD_API_KEY"),
interval = "daily",
)
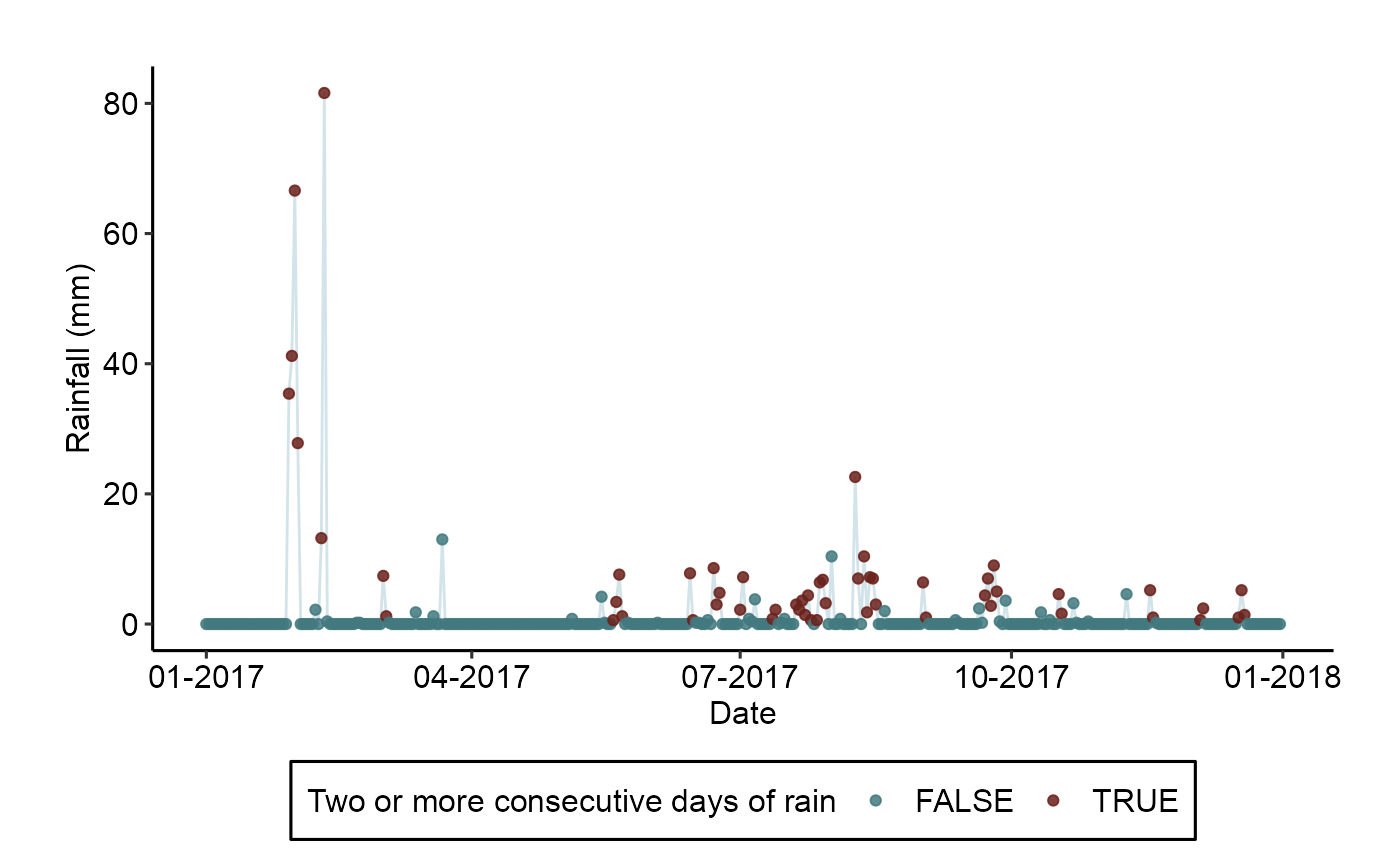
# Determine where runs of 2 or more days with rain over 0.5mm occur
rain <- rle2(
x = wd$rainfall,
index = wd$date,
l_run = 2,
value = 0.5
)
# Plot rainfall values
ggplot(data = rain, aes(x = index, y = value)) +
geom_line(colour = "light blue", alpha = 0.7) +
geom_point(aes(color = test), alpha = 0.85) +
scale_color_manual(values = c("blue", "darkred")) +
scale_x_date(labels = date_format("%m-%Y")) +
xlab("Date") +
ylab("Rainfall (mm)") +
guides(colour = guide_legend("Two or more consecutive days of rain")) +
theme(legend.position = "bottom", legend.direction = "horizontal")
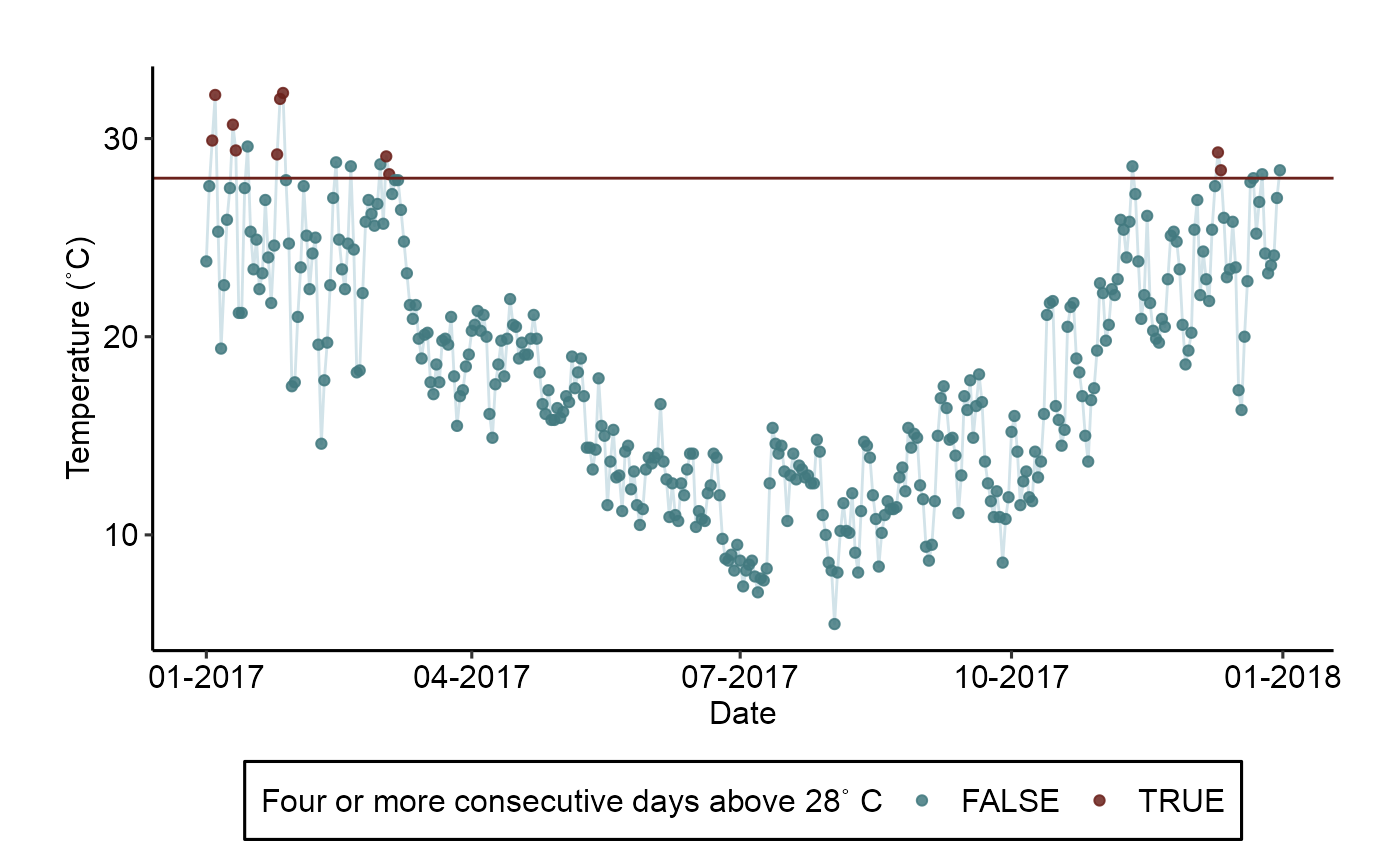
 # Determine where runs of 2 or more days avg temp above 28 C occur
tavg <- rle2(
x = wd$air_tavg,
index = wd$date,
l_run = 2,
value = 28
)
# Plot rainfall values
ggplot(data = tavg, aes(x = index, y = value)) +
geom_line(colour = "lightblue", alpha = 0.7) +
geom_point(aes(color = test), alpha = 0.85) +
scale_color_manual(values = c("blue", "darkred")) +
geom_hline(yintercept = 28, colour = "darkred") +
scale_x_date(labels = date_format("%m-%Y")) +
xlab("Date") +
ylab("Temperature (C)") +
guides(colour = guide_legend("Four or more consecutive days above 28 C")) +
theme(legend.position = "bottom", legend.direction = "horizontal")
# Determine where runs of 2 or more days avg temp above 28 C occur
tavg <- rle2(
x = wd$air_tavg,
index = wd$date,
l_run = 2,
value = 28
)
# Plot rainfall values
ggplot(data = tavg, aes(x = index, y = value)) +
geom_line(colour = "lightblue", alpha = 0.7) +
geom_point(aes(color = test), alpha = 0.85) +
scale_color_manual(values = c("blue", "darkred")) +
geom_hline(yintercept = 28, colour = "darkred") +
scale_x_date(labels = date_format("%m-%Y")) +
xlab("Date") +
ylab("Temperature (C)") +
guides(colour = guide_legend("Four or more consecutive days above 28 C")) +
theme(legend.position = "bottom", legend.direction = "horizontal")