
Retrieves daily weather data from either the NASA POWER database or ERA5
reanalysis (via the Open-Meteo Archive API) and formats it for use in
seir() and epicrop disease models.
Usage
get_wth(lonlat, dates, duration = NULL, source = c("power", "era5"))Arguments
- lonlat
Numeric vector of coordinates as
c(longitude, latitude). Longitude: -180 to 180 degrees (West/East) Latitude: -90 to 90 degrees (South/North) Example:c(121.255669, 14.167425)for IRRI, Philippines- dates
Character vector of start date and optional end date, or character scalar start date. Format:
"YYYY-MM-DD"(ISO 8601).Length 1: Use with
durationparameterLength 2+: First is start, second is end (used only if
durationis not supplied)
- duration
Optional integer. Number of days to retrieve (inclusive). If supplied, it takes precedence over any end date in
dates. Must be positive (> 0). If not provided anddateshas only one element, an error is raised.- source
Character. Weather data source, one of
"power"(default) or"era5".
Value
An epicrop.wth object (data.table::data.table() subclass) containing
daily weather data with columns:
| Column | Description | Units |
| YYYYMMDD | Date | ISO 8601 (YYYY-MM-DD) |
| DOY | Day of year | Integer (1-365/366) |
| TEMP | Mean daily temperature | Degrees C |
| TMIN | Minimum daily temperature | Degrees C |
| TMAX | Maximum daily temperature | Degrees C |
| RHUM | Mean daily relative humidity | Percent (0-100) |
| RAIN | Total daily rainfall | Millimeters |
| LAT | Latitude of query location | Degrees (-90 to 90) |
| LON | Longitude of query location | Degrees (-180 to 180) |
Ready for direct use in seir(), bacterial_blight(), leaf_blast(), and
other disease models.
Data Source
"power"(default): NASA POWER vianasapower::get_power(), global daily data from 1984 onwards at 0.5-degree resolution."era5": ERA5 from 1940 onwards at about 0.25-degree resolution, roughly 25 km, via the Open-Meteo Archive API (https://open-meteo.com/en/docs/historical-weather-api). Hourly values are aggregated to daily values (mean/min/max temperature, mean relative humidity, total precipitation) by local calendar day so that the output matches the POWER-derived columns. ERA5 data are typically available with a lag of about five days from 1940 onwards.
Both sources are modelled/reanalysis products and may differ from local
weather station observations. Note that ERA5 precipitation is not the same
quantity as POWER's bias-corrected PRECTOTCORR, so rainfall totals will
differ between sources.
Citing Weather Data
Please be kind and cite the data and their sources. To do so, please see the NASA POWER and Openmeteo websites for how to cite the data when you use them.
Retrieved Variables
This function automatically provides:
Mean daily temperature (2-meter height)
Daily minimum temperature
Daily maximum temperature
Mean daily relative humidity (2-meter height)
Total daily precipitation (bias-corrected for POWER)
All variables are provided in standard units: temperature in degrees C, humidity in %, rainfall in mm.
Date Handling
Two methods for specifying the weather window:
Start and end dates (character vector):
dates = c("2000-06-30", "2000-12-31")Start date + duration (integer):
dates = "2000-06-30", duration = 120
Duration is interpreted as inclusive days: end = start + duration - 1. For
example, duration = 120 starting on June 30 ends on October 27 (120 days
total).
References
NASA POWER project (2019). Agroclimatology, Prediction Of Worldwide Energy Resource. Funded by NASA's Applied Science Program. https://power.larc.nasa.gov/.
Hersbach, H. et al. (2020). The ERA5 global reanalysis. Quarterly Journal of the Royal Meteorological Society, 146, 1999-2049. doi:10.1002/qj.3803 .
Sparks, A. H., P. D. Esker, M. Bates, W. Dall'Acqua, Z. Guo, V. Segovia, S. D. Silwal, S. Tolos, and K. A. Garrett. (2008). Ecology and Epidemiology in R: Disease Progress over Time. The Plant Health Instructor. doi:10.1094/PHI-A-2008-0129-02 .
Zippenfenig, P. (2023) Open-Meteo.com Weather API. Zenodo. doi: doi:10.5281/ZENODO.7970649 .
Author
Adam H. Sparks, adamhsparks@gmail.com with ERA5 support adapted from code by Emerson M. Del Ponte delponte@ufv.br from the r4pde.
Examples
# Example 1: Get weather for a date range
# IRRI Zeigler Experiment Station, wet season 2000
wth_range <- get_wth(
lonlat = c(121.255669, 14.167425),
dates = c("2000-06-30", "2000-12-31")
)
head(wth_range)
#> Key: <YYYYMMDD>
#> YYYYMMDD DOY TEMP TMIN TMAX RHUM RAIN LAT LON
#> <IDat> <int> <num> <num> <num> <num> <num> <num> <num>
#> 1: 2000-06-30 182 26.60 23.94 29.89 85.99 11.94 14.16742 121.2557
#> 2: 2000-07-01 183 25.50 24.26 27.39 90.80 22.45 14.16742 121.2557
#> 3: 2000-07-02 184 26.45 24.07 30.09 85.74 14.87 14.16742 121.2557
#> 4: 2000-07-03 185 25.88 24.82 27.53 93.76 19.77 14.16742 121.2557
#> 5: 2000-07-04 186 26.12 24.97 28.08 91.53 12.15 14.16742 121.2557
#> 6: 2000-07-05 187 26.28 25.51 27.70 91.45 21.90 14.16742 121.2557
nrow(wth_range) # Number of days
#> [1] 185
# Example 2: Get weather by start date and duration
# 120-day window from June 30, 2000
wth_duration <- get_wth(
lonlat = c(121.255669, 14.167425),
dates = "2000-06-30",
duration = 120L
)
nrow(wth_duration) # Should be 120 rows
#> [1] 120
# Example 3: Verify both methods return equivalent data
# (within floating-point precision)
all.equal(wth_range[1:120], wth_duration)
#> [1] "Attributes: < Component \"POWER.Dates\": 1 string mismatch >"
# Example 4: Use retrieved weather in disease model
wth <- get_wth(
lonlat = c(121.255669, 14.167425),
dates = "2000-06-30",
duration = 120L
)
# Run bacterial blight model
bb_sim <- bacterial_blight(wth, emergence = "2000-07-01")
#> Error in .window_weather(wth = wth, emergence = emergence, duration = duration): Insufficient weather data to run 120 days after emergence
head(bb_sim)
#> Error: object 'bb_sim' not found
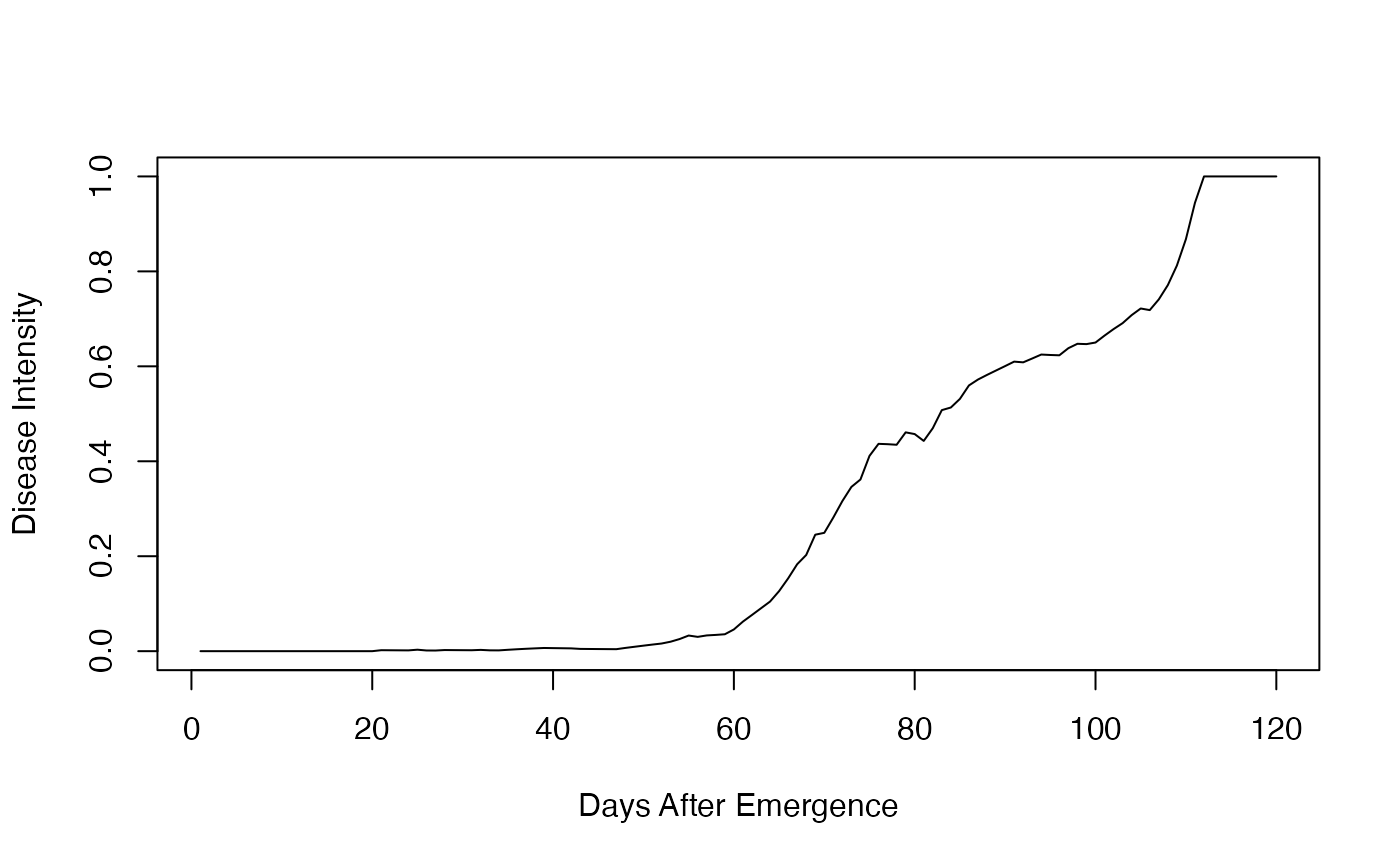
plot(
bb_sim$simday,
bb_sim$intensity,
type = "l",
xlab = "Days After Emergence",
ylab = "Disease Intensity"
)
#> Error: object 'bb_sim' not found
# Example 5: Multiple locations - compare disease risk
locations <- data.frame(
name = c("IRRI_Laguna", "BRRI_Gazipur", "CIMMYT_Mexico"),
lon = c(121.255669, 90.2167, -99.1828),
lat = c(14.167425, 24.0028, 19.1296)
)
# Get weather for each location
wth_list <- lapply(
1:nrow(locations),
function(i) {
get_wth(
lonlat = c(locations$lon[i], locations$lat[i]),
dates = "2000-06-30",
duration = 120L
)
}
)
names(wth_list) <- locations$name
# Run leaf blast model at each location
lb_results <- lapply(
wth_list,
function(w) leaf_blast(w, emergence = "2000-07-01")
)
#> Error in .window_weather(wth = wth, emergence = emergence, duration = duration): Insufficient weather data to run 120 days after emergence
# Compare AUDPC (disease intensity summary)
audpc_comparison <- data.frame(
location = names(lb_results),
AUDPC = sapply(lb_results, function(x) attr(x, "AUDPC"))
)
#> Error: object 'lb_results' not found
audpc_comparison
#> Error: object 'audpc_comparison' not found
# Example 6: Cross-year comparison (same location, different years)
years <- 2000:2002
wth_by_year <- lapply(
years,
function(y) {
get_wth(
lonlat = c(121.255669, 14.167425),
dates = paste0(y, "-06-30"),
duration = 120L
)
}
)
names(wth_by_year) <- as.character(years)
# Run model for each year
bb_by_year <- lapply(
wth_by_year,
function(w) bacterial_blight(w, emergence = unique(w$YYYYMMDD)[1])
)
# Compare disease progression across years
plot_data <- data.table::rbindlist(lapply(
seq_along(bb_by_year),
function(i) {
data.frame(
year = names(bb_by_year)[i],
simday = bb_by_year[[i]]$simday,
intensity = bb_by_year[[i]]$intensity
)
}
))
plot(
plot_data$simday,
plot_data$intensity,
col = as.factor(plot_data$year),
pch = 16
)
legend(
"topleft",
legend = names(bb_by_year),
col = seq_along(bb_by_year),
pch = 16
)
 # Example 7: Error handling
if (FALSE) { # \dontrun{
# This will fail (invalid coordinates)
get_wth(
lonlat = c(200, 95), # Out of range
dates = "2000-06-30",
duration = 120
)
# Error: Longitude must be in [-180, 180], got 200
# This will fail (invalid date format)
get_wth(
lonlat = c(121.255669, 14.167425),
dates = "30-06-2000", # Wrong format
duration = 120
)
# Error: dates[1] must be an ISO date ('YYYY-MM-DD')
# This will fail (missing date specification)
get_wth(
lonlat = c(121.255669, 14.167425),
dates = "2000-06-30" # No end date or duration
)
# Error: Provide dates as c(start, end) or supply duration
} # }
# Example 8: ERA5 data
# Get ERA5 data in the same format as POWER
wth_era5 <- get_wth(
lonlat = c(121.255669, 14.167425),
dates = "2000-06-30",
duration = 120L,
source = "era5"
)
head(wth_era5)
#> Key: <YYYYMMDD>
#> YYYYMMDD DOY TEMP TMIN TMAX RHUM RAIN LAT LON
#> <IDat> <int> <num> <num> <num> <num> <num> <num> <num>
#> 1: 2000-06-30 182 26.82917 24.9 30.0 89.37500 10.2 14.25 121.25
#> 2: 2000-07-01 183 27.02083 25.3 30.2 87.00000 42.4 14.25 121.25
#> 3: 2000-07-02 184 26.65000 24.1 29.5 89.62500 26.2 14.25 121.25
#> 4: 2000-07-03 185 26.23333 25.4 27.7 89.00000 25.7 14.25 121.25
#> 5: 2000-07-04 186 25.72083 25.0 26.4 92.37500 42.9 14.25 121.25
#> 6: 2000-07-05 187 26.34167 25.5 27.5 90.95833 31.9 14.25 121.25
# Example 7: Error handling
if (FALSE) { # \dontrun{
# This will fail (invalid coordinates)
get_wth(
lonlat = c(200, 95), # Out of range
dates = "2000-06-30",
duration = 120
)
# Error: Longitude must be in [-180, 180], got 200
# This will fail (invalid date format)
get_wth(
lonlat = c(121.255669, 14.167425),
dates = "30-06-2000", # Wrong format
duration = 120
)
# Error: dates[1] must be an ISO date ('YYYY-MM-DD')
# This will fail (missing date specification)
get_wth(
lonlat = c(121.255669, 14.167425),
dates = "2000-06-30" # No end date or duration
)
# Error: Provide dates as c(start, end) or supply duration
} # }
# Example 8: ERA5 data
# Get ERA5 data in the same format as POWER
wth_era5 <- get_wth(
lonlat = c(121.255669, 14.167425),
dates = "2000-06-30",
duration = 120L,
source = "era5"
)
head(wth_era5)
#> Key: <YYYYMMDD>
#> YYYYMMDD DOY TEMP TMIN TMAX RHUM RAIN LAT LON
#> <IDat> <int> <num> <num> <num> <num> <num> <num> <num>
#> 1: 2000-06-30 182 26.82917 24.9 30.0 89.37500 10.2 14.25 121.25
#> 2: 2000-07-01 183 27.02083 25.3 30.2 87.00000 42.4 14.25 121.25
#> 3: 2000-07-02 184 26.65000 24.1 29.5 89.62500 26.2 14.25 121.25
#> 4: 2000-07-03 185 26.23333 25.4 27.7 89.00000 25.7 14.25 121.25
#> 5: 2000-07-04 186 25.72083 25.0 26.4 92.37500 42.9 14.25 121.25
#> 6: 2000-07-05 187 26.34167 25.5 27.5 90.95833 31.9 14.25 121.25