
A fork of {cropsim} (Hijmans et al. 2009) designed to make using the EPIRICE model (Savary et al. 2012) for rice diseases easier to use and to implement the EPIWHEAT model in the same R package. This package provides easy to use functions to fetch weather data from NASA POWER, via the {nasapower} package (Sparks 2018) and ERA5 reanalysis data (Hersbach et al. 2020) (built in courtesy of Emerson Del Ponte) via Open-Meteo and predict disease intensity of five rice and two wheat diseases using a generic Susceptible-Exposed-Infectious-Removed (SEIR) model (Zadoks 1971) function, seir().
This package fully implements the EPIRICE model first published in Savary et al. (2012), which introduces the model and uses it to model global epidemics of rice diseases illustrating the risk of bacterial blight, brown spot, leaf blast, sheath blight and rice tungro disease. Additional models included for rice are adapted from Kim et al. (2015) for rice sheath blight and leaf blast. The EPIWHEAT model first published in Savary et al. (2015) that was used to model potential epidemics of two wheat diseases, leaf rust and Septoria tritici blotch, is also included in this package.
The modern core of seir() in {epicrop} uses a different numerical integration approach than the legacy SEIR() in {cropsim}. While both implement the canonical SEIR formula (diseased = latent + infectious + removed), the modern version uses cumulative delay windows instead of forward Euler integration. This results in different dynamics and typically lower AUDPC values. Additionally, the modern seir() is 1-indexed (standard R convention) while the legacy SEIR() is 0-indexed (as in the original EPIRICE publication by Savary et al. 2012).
Scripts are available in inst that benchmark and validate this version against the original EPIRICE. As the original EPIWHEAT code is not available, no such comparisons are possible. I have recreated this as closely as possible to the original, while fixing minor bugs and implementing more efficient routines. In benchmarking this iteration is up to 57% faster in seasonal disease calculations than the original EPIRICE. This varies by OS and hardware, but the gains should be notable across large datasets, e.g., several years of global data as in Savary et al. 2012.
Users may also provide their own parameters to the generic seir() function to simulate other crop diseases as long as the weather data provided meet the model’s requirements.
Quick start
{epicrop} is not yet on CRAN. You can install it this way.
install.packages(
  "epicrop",
  repos = c("https://adamhsparks.r-universe.dev", "https://cloud.r-project.org")
)
Get weather data
First you need to provide weather data for the model; {epicrop} provides the get_wth() function to do this. You can fetch weather data for any place in the world from either NASA POWER (the default, from 1984 onwards at 0.5-degree resolution) or ERA5 reanalysis (from 1940 onwards at about 0.25-degree resolution, roughly 25 km, via Open-Meteo) by providing the longitude and latitude and dates or length of rice growing season as shown below. Choose the source with the source argument, "power" or "era5". Both return the same format, ready for the disease models, but they are different products: rainfall totals in particular will differ between them.
library(epicrop)

# Fetch weather for year 2000 wet season for a 120 day rice variety at the IRRI
# Zeigler Experiment Station for both weather sources

sources <- c("power", "era5")

wth <- lapply(
  X = sources,
  FUN = get_wth,
  lonlat = c(121.25562, 14.6774),
  dates = "2000-07-01",
  duration = 120
)

names(wth) <- sources

wth
#> $power
#> Key: <YYYYMMDD>
#>        YYYYMMDD   DOY  TEMP  TMIN  TMAX  RHUM  RAIN     LAT      LON
#>          <IDat> <int> <num> <num> <num> <num> <num>   <num>    <num>
#>   1: 2000-07-01   183 25.29 23.86 27.78 92.20 23.12 14.6774 121.2556
#>   2: 2000-07-02   184 26.13 23.54 29.90 86.01 17.34 14.6774 121.2556
#>   3: 2000-07-03   185 25.50 24.28 27.23 94.16 29.08 14.6774 121.2556
#>   4: 2000-07-04   186 25.81 24.50 27.56 92.42 13.01 14.6774 121.2556
#>   5: 2000-07-05   187 25.97 25.13 27.40 92.34 32.20 14.6774 121.2556
#>  ---
#> 116: 2000-10-24   298 25.81 23.54 29.72 87.65  2.76 14.6774 121.2556
#> 117: 2000-10-25   299 25.82 23.44 29.54 89.76 12.04 14.6774 121.2556
#> 118: 2000-10-26   300 25.44 24.14 26.99 94.93 13.03 14.6774 121.2556
#> 119: 2000-10-27   301 25.74 24.54 27.69 91.43 11.54 14.6774 121.2556
#> 120: 2000-10-28   302 25.44 24.72 26.62 91.90 74.20 14.6774 121.2556
#>
#> $era5
#> Key: <YYYYMMDD>
#>        YYYYMMDD   DOY     TEMP  TMIN  TMAX     RHUM  RAIN   LAT    LON
#>          <IDat> <int>    <num> <num> <num>    <num> <num> <num>  <num>
#>   1: 2000-07-01   183 25.43750  23.3  29.0 91.95833  28.8 14.75 121.25
#>   2: 2000-07-02   184 24.85000  21.9  28.0 92.45833  27.9 14.75 121.25
#>   3: 2000-07-03   185 23.87083  23.1  25.6 94.91667  43.3 14.75 121.25
#>   4: 2000-07-04   186 23.41250  22.9  24.0 97.29167  96.0 14.75 121.25
#>   5: 2000-07-05   187 24.05833  23.3  24.9 97.04167  86.9 14.75 121.25
#>  ---
#> 116: 2000-10-24   298 26.96667  23.3  30.8 82.62500   0.1 14.75 121.25
#> 117: 2000-10-25   299 26.63750  23.1  30.9 83.45833   1.0 14.75 121.25
#> 118: 2000-10-26   300 26.04583  23.8  28.6 86.62500   5.7 14.75 121.25
#> 119: 2000-10-27   301 26.26250  23.9  28.6 87.37500   2.8 14.75 121.25
#> 120: 2000-10-28   302 24.11250  23.2  25.1 93.95833 162.6 14.75 121.25
Modelling bacterial blight disease intensity
Once you have the weather data, run the model for any of the five rice diseases by providing the emergence or crop establishment date for transplanted rice.
bb_sim <- lapply(X = wth, FUN = bacterial_blight, emergence = "2000-07-01")

bb_sim
#> $power
#>      simday      dates    sites latent infectious  removed    senesced rateinf  rlex rtransfer rremoved  rgrowth rsenesced diseased intensity     lat      lon
#>       <int>     <IDat>    <num>  <num>      <num>    <num>       <num>   <num> <num>     <num>    <num>    <num>     <num>    <num>     <num>   <num>    <num>
#>   1:      1 2000-07-01 100.0000      0     0.0000    0.000    1.000000       0     0         0  0.00000  9.68750  1.000000    0.000         0 14.6774 121.2556
#>   2:      2 2000-07-02 108.6875      0     0.0000    0.000    2.086875       0     0         0  0.00000 10.49959  1.086875    0.000         0 14.6774 121.2556
#>   3:      3 2000-07-03 118.1002      0     0.0000    0.000    3.267877       0     0         0  0.00000 11.37416  1.181002    0.000         0 14.6774 121.2556
#>   4:      4 2000-07-04 128.2934      0     0.0000    0.000    4.550811       0     0         0  0.00000 12.31499  1.282934    0.000         0 14.6774 121.2556
#>   5:      5 2000-07-05 139.3254      0     0.0000    0.000    5.944065       0     0         0  0.00000 13.32593  1.393254    0.000         0 14.6774 121.2556
#>  ---
#> 116:    116 2000-10-24   0.0000      0   396.0528 1404.565 2665.037553       0     0         0 43.67864  0.00000 39.691810 1800.618         1 14.6774 121.2556
#> 117:    117 2000-10-25   0.0000      0   356.3610 1444.257 2712.120592       0     0         0 39.69181  0.00000 47.083039 1800.618         1 14.6774 121.2556
#> 118:    118 2000-10-26   0.0000      0   309.2779 1491.340 2755.012575       0     0         0 47.08304  0.00000 42.891982 1800.618         1 14.6774 121.2556
#> 119:    119 2000-10-27   0.0000      0   266.3860 1534.232 2791.854071       0     0         0 42.89198  0.00000 36.841497 1800.618         1 14.6774 121.2556
#> 120:    120 2000-10-28   0.0000      0   229.5445 1571.073 2824.358958       0     0         0 36.84150  0.00000 32.504887 1800.618         1 14.6774 121.2556
#>
#> $era5
#>      simday      dates    sites latent infectious  removed    senesced rateinf  rlex rtransfer rremoved  rgrowth rsenesced diseased intensity   lat    lon
#>       <int>     <IDat>    <num>  <num>      <num>    <num>       <num>   <num> <num>     <num>    <num>    <num>     <num>    <num>     <num> <num>  <num>
#>   1:      1 2000-07-01 100.0000      0    0.00000    0.000    1.000000       0     0         0  0.00000  9.68750  1.000000     0.00         0 14.75 121.25
#>   2:      2 2000-07-02 108.6875      0    0.00000    0.000    2.086875       0     0         0  0.00000 10.49959  1.086875     0.00         0 14.75 121.25
#>   3:      3 2000-07-03 118.1002      0    0.00000    0.000    3.267877       0     0         0  0.00000 11.37416  1.181002     0.00         0 14.75 121.25
#>   4:      4 2000-07-04 128.2934      0    0.00000    0.000    4.550811       0     0         0  0.00000 12.31499  1.282934     0.00         0 14.75 121.25
#>   5:      5 2000-07-05 139.3254      0    0.00000    0.000    5.944065       0     0         0  0.00000 13.32593  1.393254     0.00         0 14.75 121.25
#>  ---
#> 116:    116 2000-10-24   0.0000      0   95.67886 1642.141 2664.640605       0     0         0 20.45989  0.00000 18.587944  1737.82         1 14.75 121.25
#> 117:    117 2000-10-25   0.0000      0   77.09091 1660.729 2664.640605       0     0         0 18.58794  0.00000  0.000000  1737.82         1 14.75 121.25
#> 118:    118 2000-10-26   0.0000      0   77.09091 1660.729 2664.640605       0     0         0  0.00000  0.00000  0.000000  1737.82         1 14.75 121.25
#> 119:    119 2000-10-27   0.0000      0   77.09091 1660.729 2664.640605       0     0         0  0.00000  0.00000  0.000000  1737.82         1 14.75 121.25
#> 120:    120 2000-10-28   0.0000      0   77.09091 1660.729 2664.640605       0     0         0  0.00000  0.00000  0.000000  1737.82         1 14.75 121.25
Lastly, you can visualise the result of the model run.
library(ggplot2)
library(data.table)
#> data.table 1.18.6.1 using 7 threads (see ?getDTthreads).  Latest news: r-datatable.com
#>
#> Attaching package: 'data.table'
#>
#> The following object is masked from 'package:base':
#>
#>     %notin%

# use rbindlist from {data.table} to create a single df for plotting
bb_sim <- rbindlist(bb_sim, idcol = "source")

ggplot(
  data = bb_sim,
  aes(
    x = dates,
    y = intensity,
    colour = source
  )
) +
  labs(
    y = "Intensity",
    x = "Date"
  ) +
  geom_line() +
  geom_point() +
  theme_classic()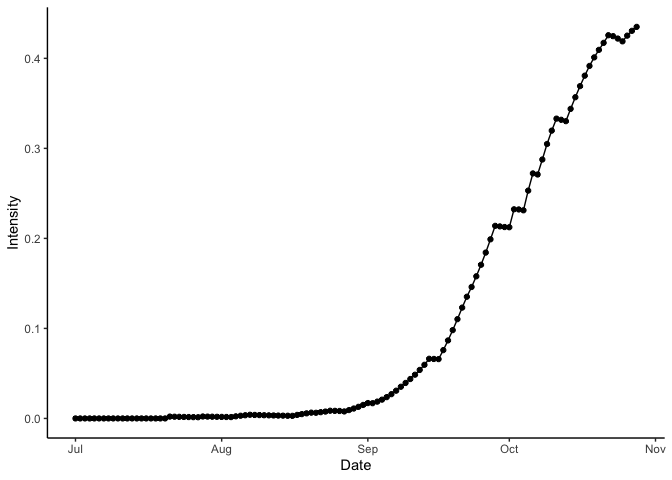
Bacterial blight disease progress over time. Results for wet season year 2000 at IRRI Zeigler Experiment Station shown. Weather data used to run the model were obtained from the NASA Langley Research Center POWER Project funded through the NASA Earth Science Directorate Applied Science Program, and from the Copernicus Climate Change Service (C3S): ERA5 hourly data on single levels from 1940 to present, Climate Data Store (CDS), DOI: 10.24381/cds.adbb2d47, accessed via Open-Meteo (Accessed on 2026-10-05). Zippenfenig, P. (2023) Open-Meteo.com Weather API. Zenodo. doi: 10.5281/ZENODO.7970649.
Meta
Please report any issues or bugs.
License: GPL-3
To cite {epicrop}, please use the output from
citation(package = "epicrop").
Code Coverage
#> epicrop Coverage: 96.72%
#> R/interpolation.R: 80.34%
#> R/validation.R: 84.62%
#> R/format_wth.R: 91.18%
#> R/get_wth.R: 94.12%
#> R/leaf_wetness.R: 97.54%
#> R/audpc.R: 97.83%
#> R/run_epicrop_model.R: 99.26%
#> R/seir.R: 99.32%
#> R/build_epicrop_emergence.R: 100.00%
#> R/disease_models.R: 100.00%
#> R/epi_get_params.R: 100.00%
#> R/fetch_epicrop_weather_list.R: 100.00%
Code of Conduct
Please note that the epicrop project is released with a Contributor Code of Conduct. By contributing to this project, you agree to abide by its terms.
Other Implementations in R
The EPIRICE model was originally written in R as a part of the {cropsim} package (Hijmans et al. 2009).
The EPIRICE model is also available from CRAN in the {ZeBook} package (Brun et al. 2018) to accompany, “Working with dynamic crop models: methods, tools and examples for agriculture and environment” (Wallach et al. 2018).
References
François Brun, David Makowski, Daniel Wallach, and James W Jones. (2018). ZeBook: Working with Dynamic Models for Agriculture and Environment. DOI: 10.32614/CRAN.package.ZeBook R package version 1.1, https://CRAN.R-project.org/package=ZeBook.
Hans Hersbach, Bill Bell, Paul Berrisford, Shoji Hirahara, András Horányi, Joaquín Muñoz-Sabater, Julien Nicolas, Carole Peubey, Raluca Radu, Dinand Schepers, Adrian Simmons, Cornel Soci, Saleh Abdalla, Xavier Abellan, Gianpaolo Balsamo, Peter Bechtold, Gionata Biavati, Jean Bidlot, Massimo Bonavita, Giovanna De Chiara, Per Dahlgren, Dick Dee, Michail Diamantakis, Rossana Dragani, Johannes Flemming, Richard Forbes, Manuel Fuentes, Alan Geer, Leopold Haimberger, Sean Healy, Robin J. Hogan, Elías Hólm, Marta Janisková, Sarah Keeley, Patrick Laloyaux, Philippe Lopez, Cristina Lupu, Gabor Radnoti, Patricia de Rosnay, Iryna Rozum, Freja Vamborg, Sebastien Villaume, and Jean-Noël Thépaut. (2020). The ERA5 global reanalysis. Quarterly Journal of the Royal Meteorological Society, 146(730): 1999-2049. DOI: 10.1002/qj.3803.
Robert J Hijmans, Serge Savary, Rene Pangga and Jorrel Aunario. cropsim. (2009). Simulation modeling of crops and their diseases. R package version 0.2-6.
Kwang-Hyung Kim, Jaepil Cho, Yong Hwan Lee, and Woo-Seop Lee. (2015). Predicting potential epidemics of rice leaf blast and sheath blight in South Korea. Agricultural and Forest Meteorology, 203: 191-207. DOI: 10.1016/j.agrformet.2015.01.011
Serge Savary, Andrew Nelson, Laetitia Willocquet, Ireneo Pangga and Jorrel Aunario. (2012). Modeling and mapping potential epidemics of rice diseases globally. Crop Protection, Volume 34, Pages 6-17, ISSN 0261-2194 DOI: 10.1016/j.cropro.2011.11.009.
Serge Savary, Stacia Stetkiewicz, François Brun, and Laetitia Willocquet. (2015). Modelling and Mapping Potential Epidemics of Wheat Diseases-Examples on Leaf Rust and Septoria Tritici Blotch Using EPIWHEAT. European Journal of Plant Pathology 142, no. 4:771–90. DOI: 10.1007/s10658-015-0650-7.
Adam Sparks. (2018). nasapower: A NASA POWER Global Meteorology, Surface Solar Energy and Climatology Data Client for R. Journal of Open Source Software, 3(30), 1035, DOI: 10.21105/joss.01035.
Daniel Wallach, David Makowski, James W Jones, and François Brun. (2018). Working with dynamic crop models: methods, tools and examples for agriculture and environment. Academic Press. DOI: 10.1016/C2016-0-01552-8.
Jan C Zadoks. (1971). Systems Analysis and the Dynamics of Epidemics. Phytopathology 61:600. DOI: 10.1094/Phyto-61-600.
Patrick Zippenfenig. (2023). Open-Meteo.com Weather API. Zenodo. doi: 10.5281/ZENODO.7970649.