Predict Rice Sheath Blight Intensity Using a Modified Kim Model
Source:R/helper_modified_kim_sheath_blight.R
modified_kim_sheath_blight.RdA helper function to provide values used by Kim et al. 2015 for a dynamic mechanistic simulation of sheath blight disease of rice, causal agent Rhizoctonia solani AG1-1A Kühn. The model is driven by daily weather data, which can easily be accessed using get_wth to download weather data from NASA POWER.
Source
Kim, Kwang-Hyung (2015). Modified EPIRICE Ref.. figshare. Dataset. doi:10.6084/m9.figshare.1515884.v1
Arguments
- wth
Weather data with a daily time-step, normally NASA POWER data from
get_wth(), but anybase::data.frame()object that has been formatted usingformat_wth()will have the following properly named columns and will work.Field Name Value YYYYMMDD Date as Year Month Day (ISO8601) DOY Consecutive day of year, commonly called "Julian date" TEMP Mean daily temperature (°C) RHUM Mean daily relative humidity (%) RAIN Mean daily rainfall (mm) TMIN Optional Minimum daily temperature (°C), see TMIN/TMAX Details TMAX Optional Maximum daily temperature (°C), see TMIN/TMAX Details LAT Optional latitude of weather observation, see LAT/LON Details LON Optional longitude of weather observation, see LAT/LON Details - emergence
Expected date of crop emergence
- ...
Additional arguments passed to
seir().
Value
A data.table::data.table() of disease intensity and infection
sites. See seir() for a full description of the column values.
Details
The model represents site size as 1 rice plant's tiller.
This model is a modified version of the Kim et al. (2015) model, which starts with a high growth rate followed by a rapid decline after the max tillering stage, based on observed tiller numbers in Korean rice varieties, Kim (personal communication). The age effect increases until max tillering and decreases after heading stage. The optimum temperature is from 23–27 ˚C.
Note
If the wth object provides LAT and LON columns, these will be included
in the output for mapping purposes. Both values must be present. These
columns are provided by default when using get_wth.
Function Provenance and Modifications to Kim et al. 2015
The original code for this function from Kim _et al. 2015 set up 120 day
growing season vector for RRG. The paper used an 85 day duration, this
function has been modified to use an RRG suitable for 85 days.
The original code for this function also had an incorrect matrix for the
relative rate of physiological growth modifier, RRG or RRPhysioloGrowth
in Kim et al. 2015. The original
matrix had the following values:
Hours:
c(4L, 6L, 8L, 10L, 12L, 14L, 16L, 18L, 20L, 22L, 24LModifier: c(0.15, 0.21, 0.11, 0.0001, 0.0001, 0.001, 0.005, 0.005, 0.005, 0.005, 0.005, 0.005, 0.005)) epicrop uses the following values:
Hours:
c(4L, 6L, 8L, 10L, 12L, 14L, 16L, 18L, 20L, 22L, 24LModifier: c(0.15, 0.21, 0.11, 0.0001, 0.0001, 0.0001, 0.0001, 0.0001, 0.0001, 0.0001, 0.0001, 0.0001)
Function Provenance and Modifications
This function is adapted from Kim et al. by Adam H. Sparks, Curtin
University, with assistance from Kwang-Hyung Kim, APEC Climate Center,
12 Centum7-ro, Haeundae-gu, Busan 612-020, South Korea.
Original model development: Serge Savary & Rene Pangga (IRRI).
Original R implementation by Robert J. Hijmans, Rene Pangga, & Jorrel
Aunario (IRRI). While the paper by Kim et al. 2015 indicates that the leaf
wetness duration changed with time rather than being 0 or 1 as in Savary
et al. 2012, the original code available does not implement this.
epicrop offers the option to do this by setting
simple_wetness = FALSE, but the results may differ from the published
values if this is used. Further changes were made to the length of the
growing season where the example code ran for 100 days, the paper ran for 77.
This function has been written to match the paper's 77 day growing season
duration and RcA and RRG have been modified accordingly.
If the wth object provides LAT and LON columns, these will be included
in the output for mapping purposes. Both values must be present. These
columns are provided by default when using get_wth.
The optimum temperature for leaf blast as presented in Table 2 of Savary et al. 2012 has a typo. The optimal value should be 20 °C, not 25 °C as shown. The correct value, 20 °C, is used in this implementation.
TMIN/TMAX Details
If simple_wetness is set to FALSE, the function will use the TMIN and
TMAXcolumns in thewthobject to calculate the leaf wetness value for 24 hours of the day using therhlimandrainlimvalues and then usesRcWto calculate a value between 0 and 1 for the whole day. Whensimple_wetnessis set toTRUE, the function only sets the leaf wetness to 0 or 1 for the day based on the rhlimandrainlim` values.
LAT/LON Details
If the wth object provides LAT and LON columns, these will be included
in the output for mapping purposes. Both values must be present. These
columns are provided by default when using get_wth().
References
Kim, K. H., Cho, J., Lee, Y. H., & Lee, W. S. (2015). Predicting potential epidemics of rice leaf blast and sheath blight in South Korea under the RCP 4.5 and RCP 8.5 climate change scenarios using a rice disease epidemiology model, EPIRICE. Agricultural and forest meteorology, 203, 191-207. doi:10.1016/j.agrformet.2015.01.011
Castilla, N.P., Leano, R.M., Elazegui, F.A., Teng, P.S., Savary, S., 1996. Effects of plant contacts, inoculation pattern, leaf wetness regime, and nitrogen supply on inoculum efficiency in rice sheath blight. Journal of Phytopathology 144:187-192.
Gross, M.K., Santini, J.B., Tikhonova, I. and Latin, R. 1998. The influence of temperature and leaf wetness duration on infection of perennial ryegrass by Rhizoctonia solani. Plant Disease 82:1012-1016. DOI: doi:10.1094/PDIS.1998.82.9.1012 .
Hashiba, T. and Ijiri, T., 1989. Estimation of yield loss and computerized forecasting system (BLIGHTAS) for rice sheath blight disease. International Symposium on Tropical Agricultural Research: Crop losses due to disease outbreaks in the tropics and countermeasures. Tropical Agricultural Research Series (Japan) No. 22 pp. 163-171.
Savary, S., Willocquet, L., Teng, P.S., 1997. Modelling sheath blight epidemics on rice tillers. Agricultural Systems 55:359-384. DOI: doi:10.1016/S0308-521X(97)00014-0 .
Savary, S., Castilla, N.P., Willocquet, L. 2001. Analysis of the spatio- temporal structure of rice sheath blight epidemics in a farmer's field. Plant Pathology 50:53-68. DOI: doi:10.1046/j.1365-3059.2001.00531.x .
Savary, S., Nelson, A., Willocquet, L., Pangga, I., and Aunario, J. Modeling and mapping potential epidemics of rice diseases globally. Crop Protection, Volume 34, 2012, Pages 6-17, ISSN 0261-2194 DOI: doi:10.1016/j.cropro.2011.11.009 .
Sharma, N.R., Teng, P.S., Olivares, F.M., 1990. Effect of rice growth stage on sheath blight (ShB) development and yield loss. International Rice Research Newsletter 15:19-20.
Tu, C.C., Chang, Y.C., Wang, C.W., 1979. Studies on the ecology of Rhizoctonia solani, the causal organism of rice sheath blight. National Science Council Monthly, ROC 7:1208-1219.
See also
Other helper functions:
bacterial_blight(),
brown_spot(),
leaf_blast(),
modified_kim_leaf_blast(),
sheath_blight(),
tungro()
Author
Kwang-Hyung Kim, Serge Savary, Ireneo Pangga, Robert Hijmans, Jorrel Khalil Aunario, and Adam H. Sparks
Examples
# get weather for IRRI Zeigler Experiment Station in wet season 2000
wth <- get_wth(
lonlat = c(121.25562, 14.6774),
dates = c("2000-05-01", "2000-09-01")
)
# use 25 May as transplanting date (`emergence`) as in Kim et al. 2015
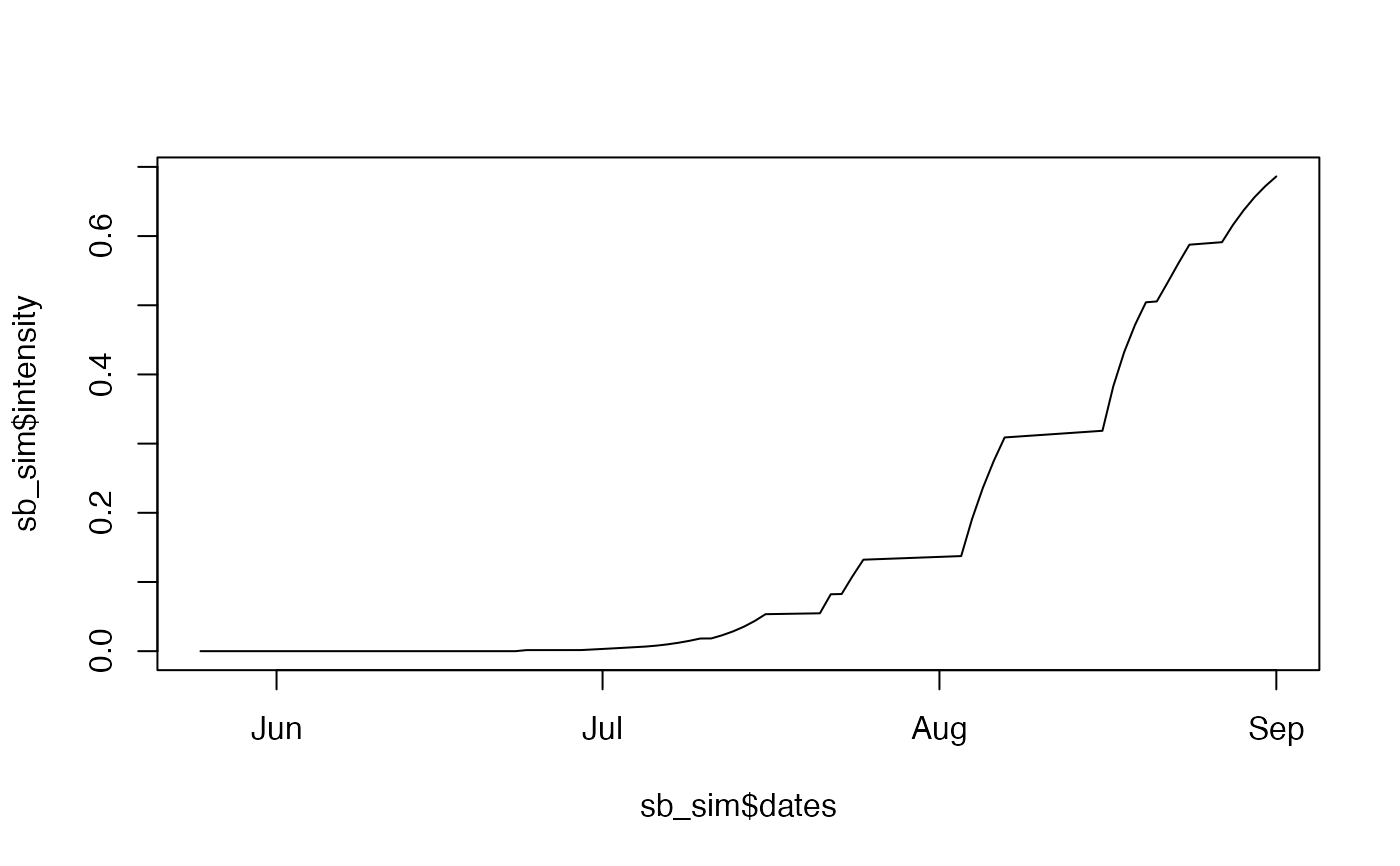
sb_sim <- modified_kim_sheath_blight(wth, emergence = "2000-05-25")
plot(x = sb_sim$dates, y = sb_sim$intensity, type = "l")
 # use shorthand function
mk_sb <- mk_sb(wth, emergence = "2000-07-01")
#> Error in seir(wth = wth, emergence = emergence, onset = 30L, duration = 100L, rhlim = 95L, rainlim = 5L, H0 = 90L, I0 = 1L, RcA = cbind(c(0L, 10L, 20L, 30L, 40L, 50L, 60L, 70L, 80L, 90L, 100L), c(0.43, 0.5, 0.73, 0.81, 0.94, 1, 1, 1, 1, 1, 0.8)), RcT = cbind(c(12L, 15L, 18L, 21L, 24L, 27L, 30L, 33L, 36L, 39L), c(0, 0.1, 0.8, 1, 1, 1, 0.2, 0.01, 0.01, 0)), RcOpt = 0.58, p = 4L, i = 65L, Sx = 800L, a = 2.8, RRS = 0.005, RRG = cbind(c(0L, 10L, 20L, 30L, 40L, 50L, 60L, 70L, 80L, 90L, 100L), c(0.15, 0.21, 0.11, 0.0001, 0.0001, 0.0001, 0.0001, 0.0001, 0.0001, 0.0001, 0.0001)), RcW = cbind(c(4L, 6L, 8L, 10L, 12L, 14L, 16L, 18L, 20L, 22L, 24L), c(0, 0.24, 0.41, 0.68, 0.94, 0.97, 1, 1, 1, 1, 1)), simple_wetness = TRUE): Incomplete weather data or dates do not align.
plot(x = mk_sb$dates, y = mk_sb$intensity, type = "l")
#> Error in mk_sb$dates: object of type 'closure' is not subsettable
# use shorthand function
mk_sb <- mk_sb(wth, emergence = "2000-07-01")
#> Error in seir(wth = wth, emergence = emergence, onset = 30L, duration = 100L, rhlim = 95L, rainlim = 5L, H0 = 90L, I0 = 1L, RcA = cbind(c(0L, 10L, 20L, 30L, 40L, 50L, 60L, 70L, 80L, 90L, 100L), c(0.43, 0.5, 0.73, 0.81, 0.94, 1, 1, 1, 1, 1, 0.8)), RcT = cbind(c(12L, 15L, 18L, 21L, 24L, 27L, 30L, 33L, 36L, 39L), c(0, 0.1, 0.8, 1, 1, 1, 0.2, 0.01, 0.01, 0)), RcOpt = 0.58, p = 4L, i = 65L, Sx = 800L, a = 2.8, RRS = 0.005, RRG = cbind(c(0L, 10L, 20L, 30L, 40L, 50L, 60L, 70L, 80L, 90L, 100L), c(0.15, 0.21, 0.11, 0.0001, 0.0001, 0.0001, 0.0001, 0.0001, 0.0001, 0.0001, 0.0001)), RcW = cbind(c(4L, 6L, 8L, 10L, 12L, 14L, 16L, 18L, 20L, 22L, 24L), c(0, 0.24, 0.41, 0.68, 0.94, 0.97, 1, 1, 1, 1, 1)), simple_wetness = TRUE): Incomplete weather data or dates do not align.
plot(x = mk_sb$dates, y = mk_sb$intensity, type = "l")
#> Error in mk_sb$dates: object of type 'closure' is not subsettable